


In June 2024, all three of the AIER Business Conditions indicators maintained their levels from the previous month. The Leading Indicator stood at a mildly expansionary level of 54, while the Roughly Coincident Indicator remained at 83 and the Lagging Indicator at a moderately contractionary 42.


Leading Indicator (54)
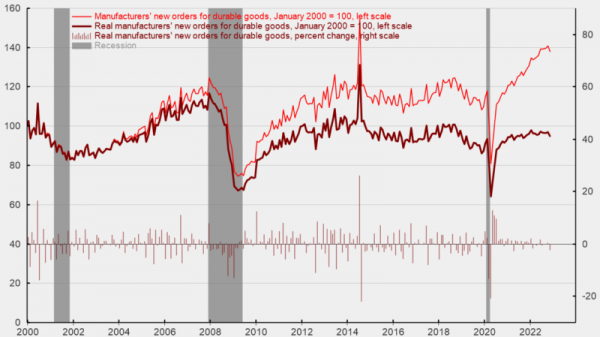
Among the twelve Leading Indicator components, from May to June 2024 seven rose, two fell, and three were neutral. Among the rising constituents were the 1-to-10 year US Treasury spread (5.8 percent), US Initial Jobless Claims (4.4 percent), Conference Board US Leading Index of Stock Prices (3.4 percent), University of Michigan Consumer Expectations Index (1.2 percent), US New Privately Owned Housing Units Started by Structure (1.1 percent), Conference Board US Leading Index Manufacturing, New Orders, Consumer Goods and Materials (0.6 percent), and the Conference Board US Manufacturers New Orders Nondefense Capital Good Ex Aircraft (0.1 percent).
United States Heavy Truck Sales fell 8.7 percent, and the Adjusted Retail and Food Service Sales declined 0.2 percent. The US Average Weekly Hours All Employees Manufacturing, Inventory/Sales Ratio: Total Business, and FINRA Customer Debit Balances in Margin Accounts remained unchanged.
Roughly Coincident (83) and Lagging Indicators (42)
In the Roughly Coincident Indicator, five components rose and one declined. From May to June 2024, Industrial Production and Coincident Personal Income Less Transfer Payments each gained 0.3 percent, while Coincident Manufacturing and Trade Sales and the US Labor Force Participation Rate rose 0.2 percent. US Employees on Nonfarm Payrolls rose by 0.1 percent, and the Conference Board Consumer Confidence Present Situation Index declined by 3.9 percent.
Among the six Lagging Indicators, one rose, four declined, and one was neutral.
Core CPI year-over-year fell by 2.9 percent, the Conference Board US Lagging Average Duration of Unemployment by 2.4 percent, and both the Census Bureau’s Private Construction Spending (Nonresidential) and US Commercial Paper Placed Top 30 Day Yields by 0.1 percent. US Manufacturing and Trade Inventories increased 0.3 percent while US Lagging Commercial and Industrial Loans rose were flat.
The substantial divergence among the three indices perpetuates a trend of ambiguity rather than clarity. However, as will be elaborated in the discussion section, with the benefit of observing developments through July and mid-August there is increasing evidence that the Lagging Indicator has provided the most accurate reflection of underlying economic conditions.
Discussion
At the end of July 2024, applications for US unemployment benefits surged to their highest point in nearly a year, clearly indicating a labor market slowdown: initial claims for the week ending on July 27th increased by 14,000 to 249,000, exceeding the 236,000 expected. Continuing claims, representing the number of individuals receiving unemployment benefits, rose to 1.88 million in the week ending July 20 – the highest level since November 2021.
Further, recent Worker Adjustment and Retraining Notification (WARN) data indicate that the layoffs which began in California’s tech sector are now spreading across Sun Belt states and industries. Texas has been particularly impacted, as have Nevada and Tennessee. Over half of US states, including Washington, DC, have experienced rising unemployment since March 2024. Approximately 35 percent of the US population now resides in areas where the three-month average unemployment rate has risen by more than 50 basis points from its twelve-month low.
The July 2024 Institute for Supply Management (ISM) manufacturing survey underscored the significant deterioration in labor market conditions. Although the survey’s overall index underperformed expectations, registering 46.8 compared to the anticipated 48.8, the most concerning development was the employment component’s steep drop to 43.4, well below the projected 49.2. That figure represents the lowest level since June 2020, and, excluding the pandemic period, the weakest reading since 2009. The underperformance in new orders further accentuates the prevailing economic weakness, as does the decline of average weekly hours worked to approximately 34.2. This is only the third occurrence of that level in the past two decades. The previous instances coincided with the 2008 and 2020 recessions.
The sharper-than-expected decline in July’s industrial production statistics likely exposes the impact of restrictive monetary policy on the real economy. Durable consumer goods and business equipment production are both on a downward trajectory, signaling weak factory output. Among the key results:
- Industrial production fell by 0.6 percent in July.
- Manufacturing output decreased by 0.3 percent.
- Consumer goods production dropped by 1.0 percent, following an 0.6 percent rise in June, with consumer durables such as automotive products and appliances—categories sensitive to interest rates—falling by 4.0 percent in July and 5.2 percent on a year-over-year basis.
- Nondurable consumer goods output saw an 0.2 percent decline after a 0.7 percent increase in June. Including intermediate nondurables, production increased by 0.4 percent, similar to June’s performance.
- Despite unusually warm weather in early July, electricity output decreased by 4.3 percent, significantly contributing to the overall drop in industrial production.
- Capacity utilization fell sharply to 77.8 percent from 78.4 percent in June, reflecting both reduced factory activity and worker hours.
The Empire State and Philadelphia Fed manufacturing surveys for August 2024 served to reinforce indications of a softening in activity with a notable decline in employment metrics. The Empire State index slightly improved to -4.7, while the Philly Fed index dropped sharply to -7.0, reflecting mixed underlying details including declining new orders in New York and slower growth in Philly. Despite surface variations in the data, both surveys showed declines in employee numbers and average hours worked. Numerous signs of contraction in interest-sensitive sectors indicate that producers are scaling back in anticipation of weakening demand.
On the consumer side, in July, US spending was predominantly channeled towards essential grocery items, with discretionary spending remaining subdued. The 1 percent rise in headline retail sales exceeded expectations, driven largely by a recovery in auto sales, while the control group’s modest 0.3 percent gain reflects a cautious consumer environment. Excluding autos and gasoline, sales grew by 0.4 percent, marking a deceleration from the previous month and highlighting ongoing consumer restraint.
The tepid growth in consumption underscores an increasing reliance on discount-driven purchases as strained consumers navigate weak financial fundamentals. The food services sector, a critical indicator of service demand, showed a slight rebound with a 0.3 percent increase, yet continues to lag behind typical growth patterns, further illustrating cautious spending behavior.
A somewhat brighter spot can be found in recent inflation data, which suggest progress in the Federal Reserve’s disinflation efforts. The June Personal Consumption Expenditure (PCE) index and several months of core inflation prints roughly aligned with the Fed’s 2 percent target indicate that the central bank may soon have the latitude to cut rates. Headline PCE inflation rounded up to 0.1 percent month-over-month in June, while the core PCE deflator rose modestly to 0.18 percent, slightly exceeding estimates. July’s Consumer Price Index (CPI) report showed a softening in the core measure, though inflation in core services such as housing rents and car insurance remains elevated, suggesting a mixed outcome for the core PCE deflator. If forecasts hold, the combination of July’s CPI and Producer Price Index (PPI) data imply an acceleration in the core PCE deflator on both monthly and annual bases. Nevertheless, the one-, three-, and six-month annualized changes in core CPI were 2.0 percent, 1.6 percent, and 2.8 percent respectively, with the first two measures meeting the Fed’s target pace and the third approaching it. Although PPI components feeding into the core PCE deflator were slightly softer in July, rising financial-service costs continue to exert upward pressure on this key inflation gauge.
All of these factors have intensified calls for rate cuts and increased demand for long-duration assets. The frequent occurrence of headfakes and reversals in various economic indicators and aggregates in recent years necessitate a cautious interpretation of even seemingly clear economic trends, such as those now describing a contractionary path. While the Federal Reserve’s progress in controlling inflation may provide the latitude needed to begin rate cuts aimed at supporting employment and growth, the activation of the Sahm Rule suggests that the United States has either entered, or is on the verge, of entering a recession.
LEADING INDICATORS


ROUGHLY COINCIDENT INDICATORS


LAGGING INDICATORS


CAPITAL MARKET PERFORMANCE